
How Visual Reports Can Transform Your Content Strategy
Why Visual Reports Are a Game-Changer for Content Strategy
In today’s fast-paced social media landscape, data can feel overwhelming. Endless spreadsheets and raw numbers rarely tell the full story. That’s where visual reports come in—transforming complex metrics into clear, actionable insights that guide your content decisions with confidence.
By turning engagement rates, audience demographics, and performance trends into easy-to-digest charts and graphs, you can quickly spot what’s working, what needs tweaking, and where the biggest opportunities lie. With a tool like Iconosquare, you get professional-grade visual reports without the hassle.
Key Benefits of Visual Reports
- Clarity at a Glance: Visualizations highlight top-performing posts, peak engagement times, and audience growth in an instant.
- Data-Driven Decisions: Stop guessing which content resonates—rely on charts that pinpoint your best topics, formats, and captions.
- Team Alignment: Share presentation-ready reports with stakeholders, ensuring everyone is on the same page.
- Time Savings: Automate report generation and scheduling, freeing you up to focus on creativity rather than number-crunching.
How Iconosquare Elevates Your Visual Reporting
Iconosquare is built for marketers, agencies, and social media managers who need clear, customized analytics without spending hours in Excel. Here’s how it empowers your visual reports:
- Automated Dashboards: Create live dashboards that update in real time, giving you an up-to-date snapshot of your social performance.
- Customizable Templates: Choose from a library of report layouts or build your own—tailor metrics, date ranges, and branding to match your needs.
- Presentation-Ready Exports: Download PDF or PowerPoint versions of your visual reports, complete with logos and commentary sections.
- Advanced Filtering: Drill down by platform, campaign, hashtag, or audience segment to reveal hidden patterns and growth drivers.
Building a Data-Driven Content Strategy
Visual reports do more than showcase past performance—they lay the groundwork for future success. Follow these steps to integrate them into your content strategy:
- Define Your KPIs: Identify the metrics that matter most—engagement rate, reach, saved posts, or link clicks.
- Set Clear Goals: Use historical data to set realistic benchmarks for each KPI.
- Analyze Trends: Leverage visual timelines to spot seasonal dips or peaks in performance.
- Optimize Content Types: Compare image versus video performance, carousel interactions, and Stories completion rates.
- Iterate and Adapt: Schedule monthly or weekly visual reports to track progress and refine your strategy in real time.
Seamless Scheduling and Collaboration
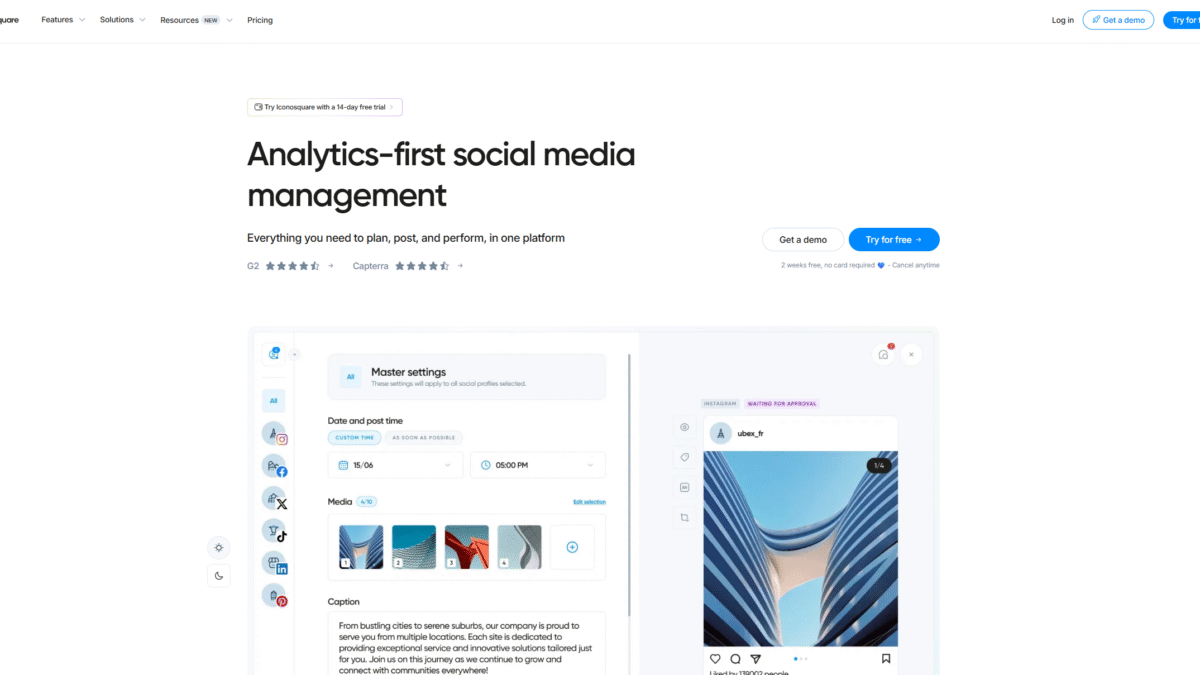
Beyond visual reports, Iconosquare streamlines your entire workflow. Schedule posts ahead of time for multiple platforms, manage your media library, and invite team members or clients for feedback—all within one intuitive interface.
Whether you’re coordinating with a remote design team or seeking approval from stakeholders, the collaboration tools ensure every post aligns with your brand voice and strategy before it goes live.
Your Next Step: Try Iconosquare Free for 14 days Today
Ready to revolutionize your content planning with stunning visual reports and data-driven insights? Try Iconosquare Free for 14 days Today and experience the easiest-to-use platform for social media analytics, scheduling, and AI-powered inspiration.
Join hundreds of top brands and agencies who trust Iconosquare to build fail-proof content strategies based on concrete data. Give it a try and see how visual reports can transform the way you plan, publish, and perfect your social media presence.