
Build Powerful Customer Dashboards for Better Insights
In today’s data-driven world, a well-designed dashboard is the difference between guesswork and true business insight. Companies that empower customers with interactive, real-time reporting win loyalty, reduce support tickets, and drive upsell opportunities. Yet building and maintaining an embedded analytics layer can tie up engineering resources for months—until now.
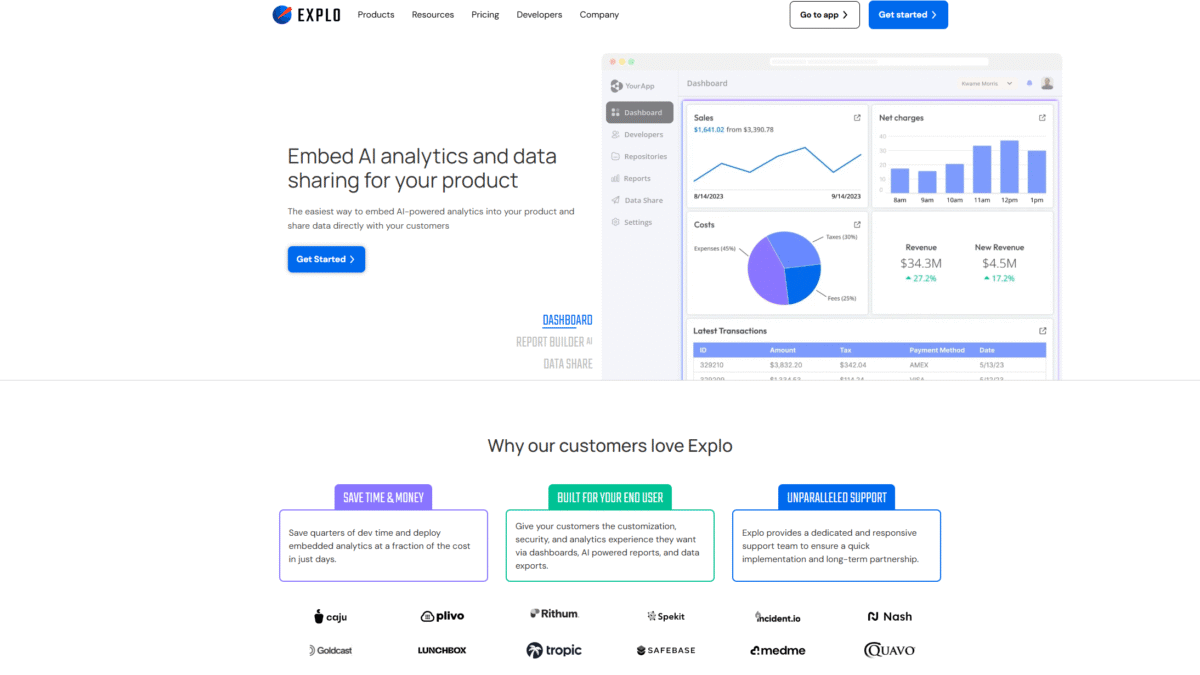
With Explo, you can deliver customizable customer-facing dashboards in days, not quarters. No complex data modeling, no ETL pipelines, and no heavy dev lift. Let’s explore how dashboards powered by Explo transform data into actionable insights for your end users.
Why Customer Dashboards Matter
Dashboards serve as command centers for customers. They consolidate metrics, visualize trends, and highlight anomalies at a glance. Here’s why they’re critical:
- Faster decisions: Real-time charts and KPIs enable users to spot issues before they escalate.
- Self-serve analytics: Customers can explore data on their own, reducing reliance on your support team.
- Value demonstration: A polished analytics UI showcases the ROI of your platform, boosting retention.
Common Challenges in Building Embedded Analytics
Traditional approaches often involve duplicating data into a separate warehouse, building custom BI components, and writing endless SQL queries. Teams face:
- Data replication overhead and latency
- Complex, brittle custom visualizations
- High development costs and long timelines
- Difficulty enforcing security and row-level permissions
How Explo Simplifies Dashboard Development
Explo is a customer-facing analytics solution that plugs directly into your existing database. No replication, no extra data models, just instant access to live data. Here’s the four-step flow:
- Connect: Hook any relational database or warehouse directly to Explo in minutes.
- Build: Use flexible components to craft interactive charts, tables, and filters without writing code.
- Style: Match fonts, colors, borders, and shadows so dashboards feel native to your app.
- Embed: Drop dashboards into your UI, send share links, email reports, or spin up white-labeled portals.
Key Features of Explo Dashboards
Editable Dashboards
Give end users control to adjust layouts, apply filters, and drill down into metrics within guardrails you define.
Report Builder
Empower customers to build ad hoc reports by selecting datasets, dimensions, and measures—no SQL required.
GenAI Insights
Leverage Explo AI to let users ask free-text questions and receive charts or graphs that answer their queries.
Custom Styling & White-Labeling
Ensure dashboards blend seamlessly with your brand using full CSS control and white-labeled embed options.
Security & Compliance
Built for enterprises: SOC II Type 2, GDPR, HIPAA, region-specific stacks, and on-prem deployments.
Benefits at a Glance
- Rapid deployment: Spin up embedded dashboards in days, not months.
- Lower TCO: Save quarters of engineering time and cut hosting costs.
- Better UX: Modern, interactive analytics that keep customers engaged.
- Scalable security: Row-level permissions and single sign-on for peace of mind.
- Dedicated support: Onboarding specialists and a responsive team ensure smooth implementation.
Who Should Use Explo?
SaaS Founders & Product Managers
Accelerate your roadmap by shipping analytics features without diverting core development resources.
Data Teams
Expose curated datasets directly to customers, enforce governance, and eliminate manual report requests.
Enterprises
Deploy compliant, white-labeled analytics at scale, backed by SLA-driven support.
Ready to Transform Your Customer Dashboards?
Stop wrestling with custom BI builds and data pipelines. Get started today with Explo and deliver powerful dashboards that delight customers and drive growth.