
Boost Conversions with Advanced Funnel Analytics Insights
Are you seeking actionable strategies to optimize every step of your user journey? With funnel analytics, you can pinpoint hurdles, understand drop-off points, and sharpen every touchpoint to boost conversions. That’s where Amplitude comes in—your all-in-one analytics platform to track, analyze, and improve your funnels. Get Started with Amplitude for Free Today and turn your data into growth-driving insights.
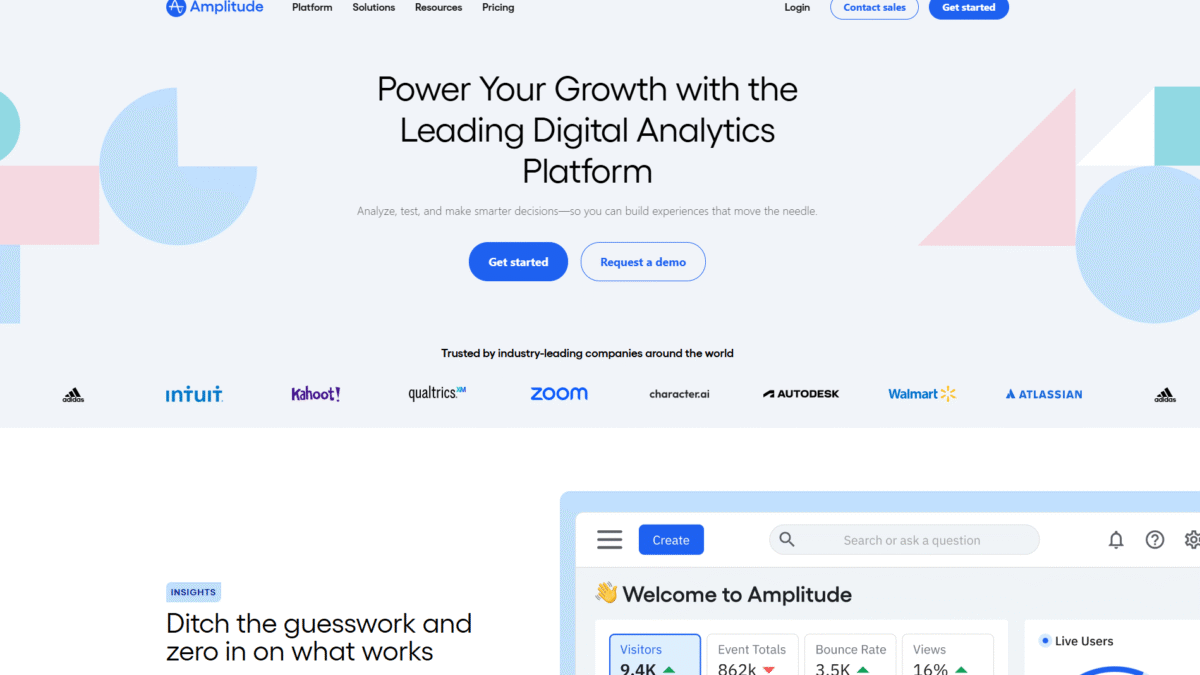
In a world of fragmentary metrics and legacy dashboards, getting a clear, unified view of how users navigate from discovery to purchase can feel impossible. Amplitude’s product analytics, session replay, and experimentation toolkit eliminate guesswork. Over the next few sections, you’ll learn what funnel analytics truly means, how to implement it effectively, and why thousands of companies trust Amplitude to power their growth.
What Is Funnel Analytics?
At its core, funnel analytics is the process of measuring and optimizing the steps users take toward a defined goal—whether that’s signing up, upgrading to premium, or completing a checkout. Unlike generic page-view reports, funnel analytics tracks discrete events and sessions, so you can see exactly where prospects drop off and why.
By mapping out each stage—acquisition, activation, retention, referral, revenue—you build a clear picture of your user lifecycle. Then you can answer critical questions: Which channel drives the highest-quality traffic? Which onboarding step confuses new users? Where should you run an A/B test to maximize lift? Funnel analytics gives you the data to decide.
Key Stages of a High-Performing Funnel
1. Acquisition
Identify which marketing campaigns, referral sources, or paid channels bring in the most engaged users. Track clicks, ad impressions, and first-touch events to allocate budget where it matters.
2. Activation
Define the “aha” moment that shows real value—like completing a profile or creating a first project. This stage sets the tone for long-term engagement.
3. Engagement & Retention
Monitor repeat visits, key feature use, and session frequency. High retention signals product-market fit, while drop-off flags friction points.
4. Monetization
Measure upgrade clicks, trial conversions, and in-app purchase events. Is pricing clear? Is billing seamless? These metrics drive revenue optimization.
5. Referral
Track invites, shares, and social actions. Satisfied users become advocates—and your best growth engine.
Why Amplitude Is Ideal for Funnel Analytics
Amplitude combines next-gen digital analytics with experimentation and session replay to provide a 360° view of your funnel. Here’s how:
- Product Analytics: Capture every click, tap, and conversion with one line of code. Visualize multi-step funnels and drop-off heatmaps in seconds.
- Web Analytics: Move beyond page views. See which campaigns and channels drive the highest completion rates, and which cause bounces.
- Session Replay: Watch real users navigate your onboarding flow. Spot hesitation points, UI glitches, and frustration in real time.
- Experimentation: Test headline copy, button colors, or new features. With feature flags and A/B testing built in, you can iterate faster and roll out with confidence.
- AI-Powered Insights: Ask natural-language questions like “Where do users drop off in checkout?” and get instant answers—no SQL required.
Implementing Funnel Analytics in Amplitude
Step 1: Define Your Events
Start by instrumenting critical events: “Sign Up Started,” “Sign Up Completed,” “First Feature Use,” “Upgrade Clicked.” Use Amplitude’s SDKs to ensure consistent naming and properties.
Step 2: Build Your Funnel Report
In the Amplitude dashboard, click “New Funnel,” select your sequence of events, and choose date ranges or segments. Watch as your conversion rates and drop-off percentages appear instantly.
Step 3: Segment and Compare
Slice by user cohorts—device type, geography, campaign source—to uncover hidden patterns. Is mobile onboarding lagging behind desktop? Drill in to find out why.
Step 4: Replay Sessions
Drop into individual user sessions to see what happened when someone abandoned at step 2. Pinpoint form errors, confusing copy, or performance lag.
Step 5: Experiment and Optimize
Launch A/B tests directly from Amplitude with Web Experiment or Feature Experiment. Measure how changes affect each funnel step, then roll out winners globally.
Ready to transform your funnel into a conversion engine? Get Started with Amplitude for Free Today and eliminate guesswork from growth.
Best Practices for Funnel Optimization
- Set Clear Goals: Define success metrics for each stage—activation rate, trial-to-paid conversion, referral share.
- Monitor Continuously: Real-time dashboards alert you to drops before they become crises.
- Prioritize High-Impact Tests: Focus on steps with the largest drop-off or highest traffic volume.
- Leverage Qualitative Feedback: Use in-app Surveys and feedback widgets to understand the “why” behind the data.
- Iterate Rapidly: With built-in feature flags and controlled rollouts, you can test five changes in the time you used to run one.
Conclusion
Mastering funnel analytics is essential for driving sustainable growth. By defining clear event flows, segmenting your audience, replaying sessions, and running smart experiments, you can systematically remove friction and boost conversions. Amplitude unifies product analytics, session replay, web experimentation, and AI insights—all in one platform.
Don’t let your funnel leak revenue. Get Started with Amplitude for Free Today and take control of your growth journey.

